Observability
Keeping a watchful eye on your applications,network and infrastructure is crucial for ensuring optimal performance, identifying bottlenecks, and troubleshooting issues promptly. AWS observability lets you collect, correlate, aggregate, and analyze telemetry in your network, infrastructure, and applications so you can gain insights into the behavior, performance, and health of your system. These insights help you detect, investigate, and remediate problems faster.
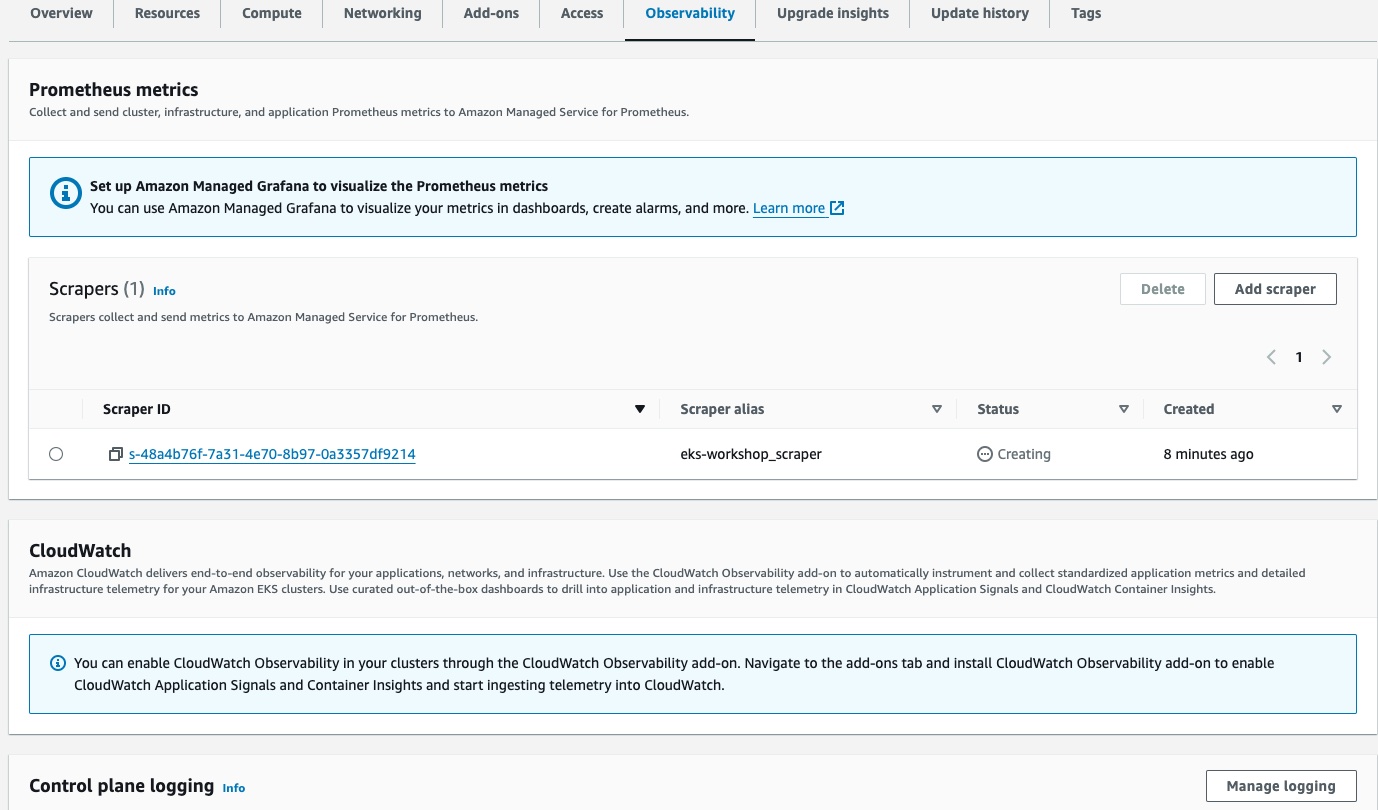
Observability tab on the EKS console provides a comprehensive view on the end-to-end observability for EKS clusters. As shown below, use either Prometheus metrics or CloudWatch metrics to collect, and send cluster, infrastructure and application metrics to Amazon Managed Service for Prometheus . You can use Amazon Managed Grafana to visualize the metrics in dashboard and create alerts.
Prometheus discovers and collects metrics from the cluster through a pull-based model called scraping. Scrapers are setup to gather data from your cluster infrastructure and containerized applications. Use Add scraper to setup a scraper for the cluster.
You can enable CloudWatch Observability in your clusters through the CloudWatch Observability add-on. Navigate to the add-ons tab and install CloudWatch Observability add-on to enable CloudWatch Application Signals and Container Insights and start ingesting telemetry into CloudWatch.